See your workspace at a glance with Activity
One tab for spending, your usage, the leaderboard, recent requests, and recent changes. It replaces Overview, Usage, Leaderboard, Logs, and Audit.
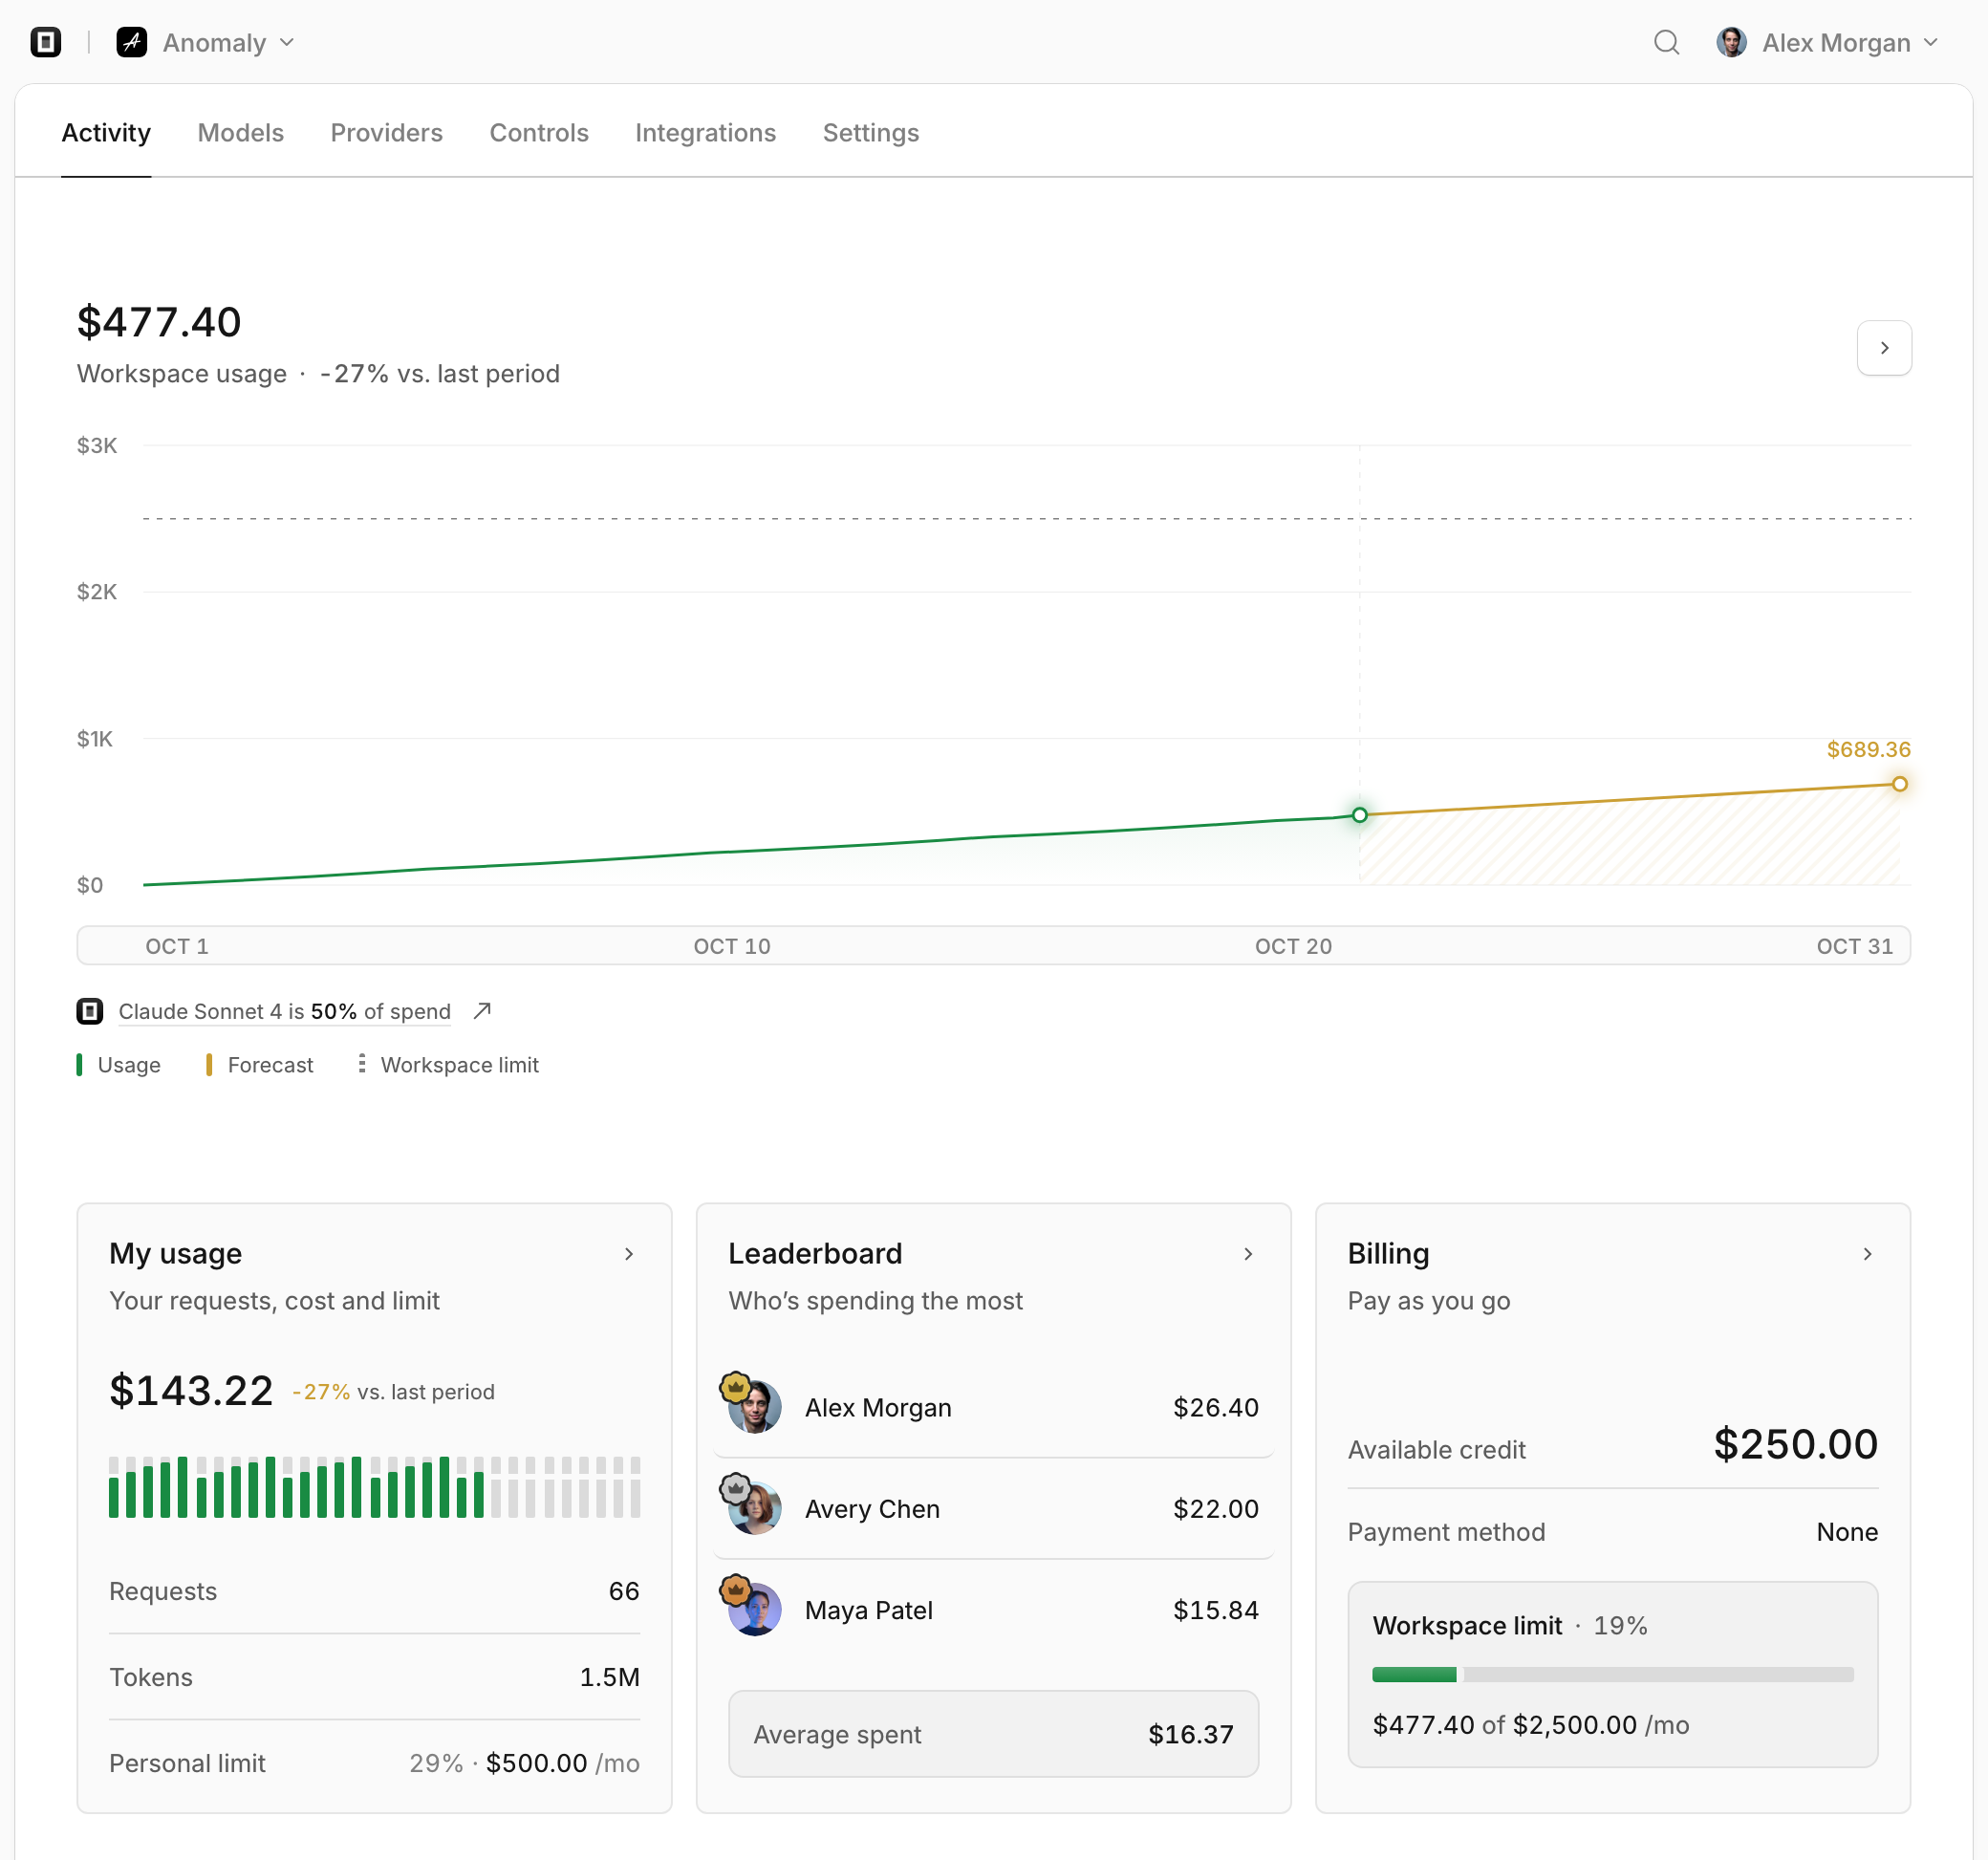
Activity is the new first tab in every workspace, and it's where you land when you open one. It replaces five tabs: Overview, Usage, Leaderboard, Logs, and Audit.
What's on the page
The chart at the top shows your workspace's spending so far this month, how it compares with the same days last month, and a forecast for the rest of the month. If a policy sets a budget for the entire workspace, its limit appears on the chart too.
Below the chart:
- My usage shows your own requests, tokens, and spending, and how much of your personal limit you've used.
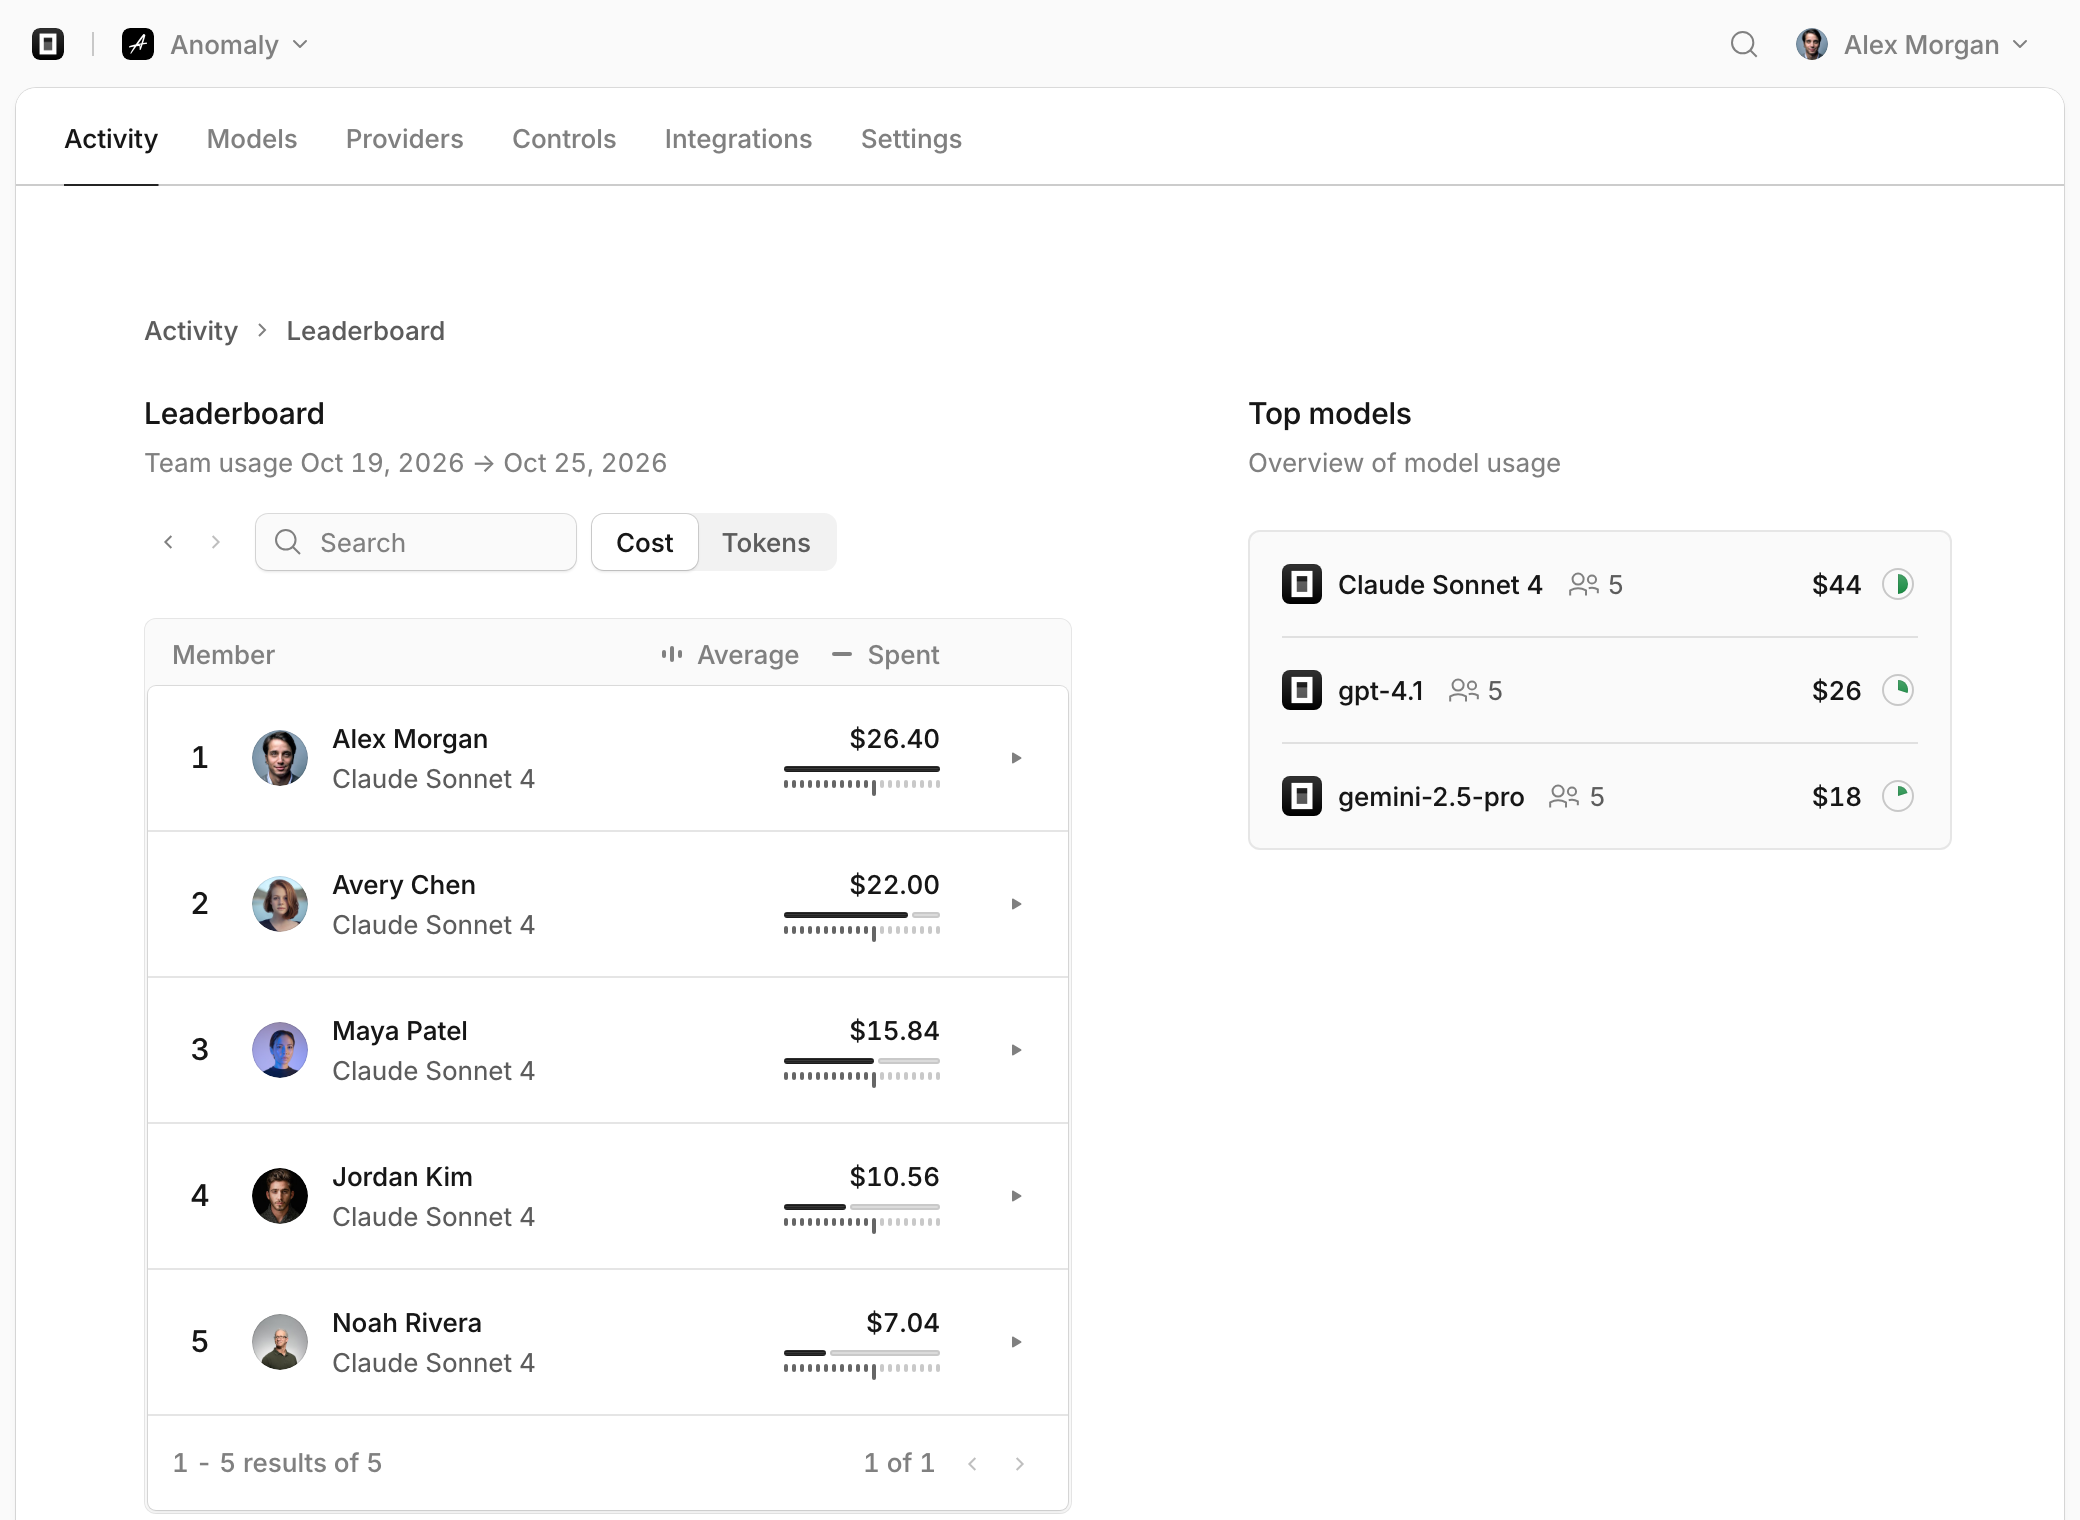
- Leaderboard shows who's spending the most this week.
- Billing shows your available credit, your payment method, and how much of the workspace limit has been used.
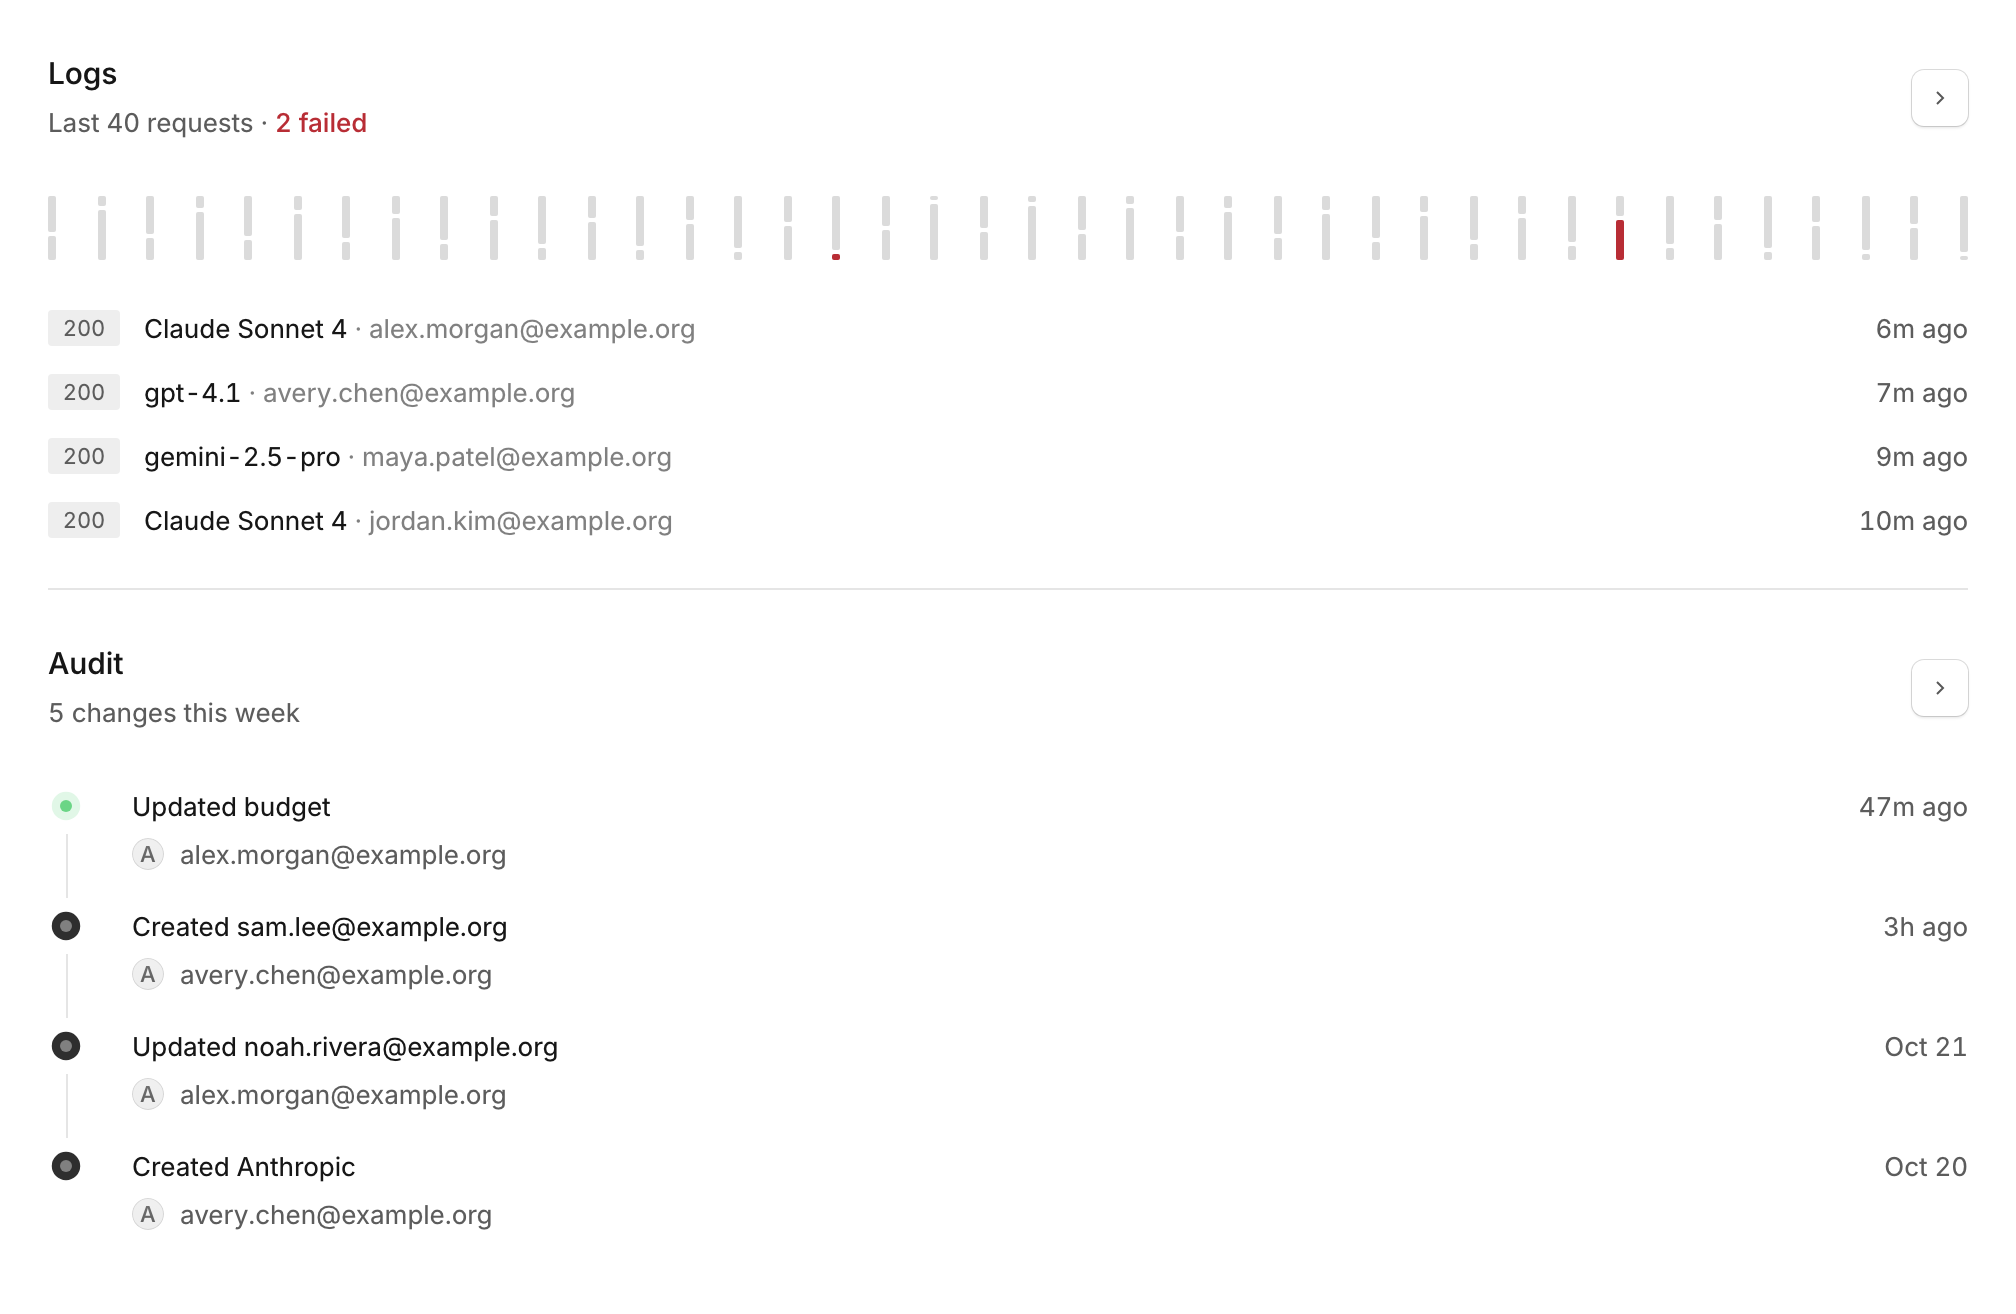
- Logs charts the last 40 requests by how long they took and lists the newest ones. Failures stand out in red.
- Audit counts this week's configuration changes and lists the latest ones.
Where the old tabs went
Every page is still here. Click a section's title or its arrow to open the full page:
- Overview is now Activity → Overview. Open it from My usage.
- Usage is now Activity → Usage. Open it from the chart.
- Leaderboard, Logs, and Audit keep their names under Activity.
The Billing card opens Settings → Billing. Every full page has an Activity breadcrumb to take you back, and links and bookmarks to the old pages still work.
Who sees what
Owners and admins see the whole workspace: its spending and forecast, the leaderboard, billing, everyone's requests, and the audit trail.
Members see their own spending against their personal limit, their own requests, and the leaderboard if your workspace shares it with members.
If you use OpenCode Go
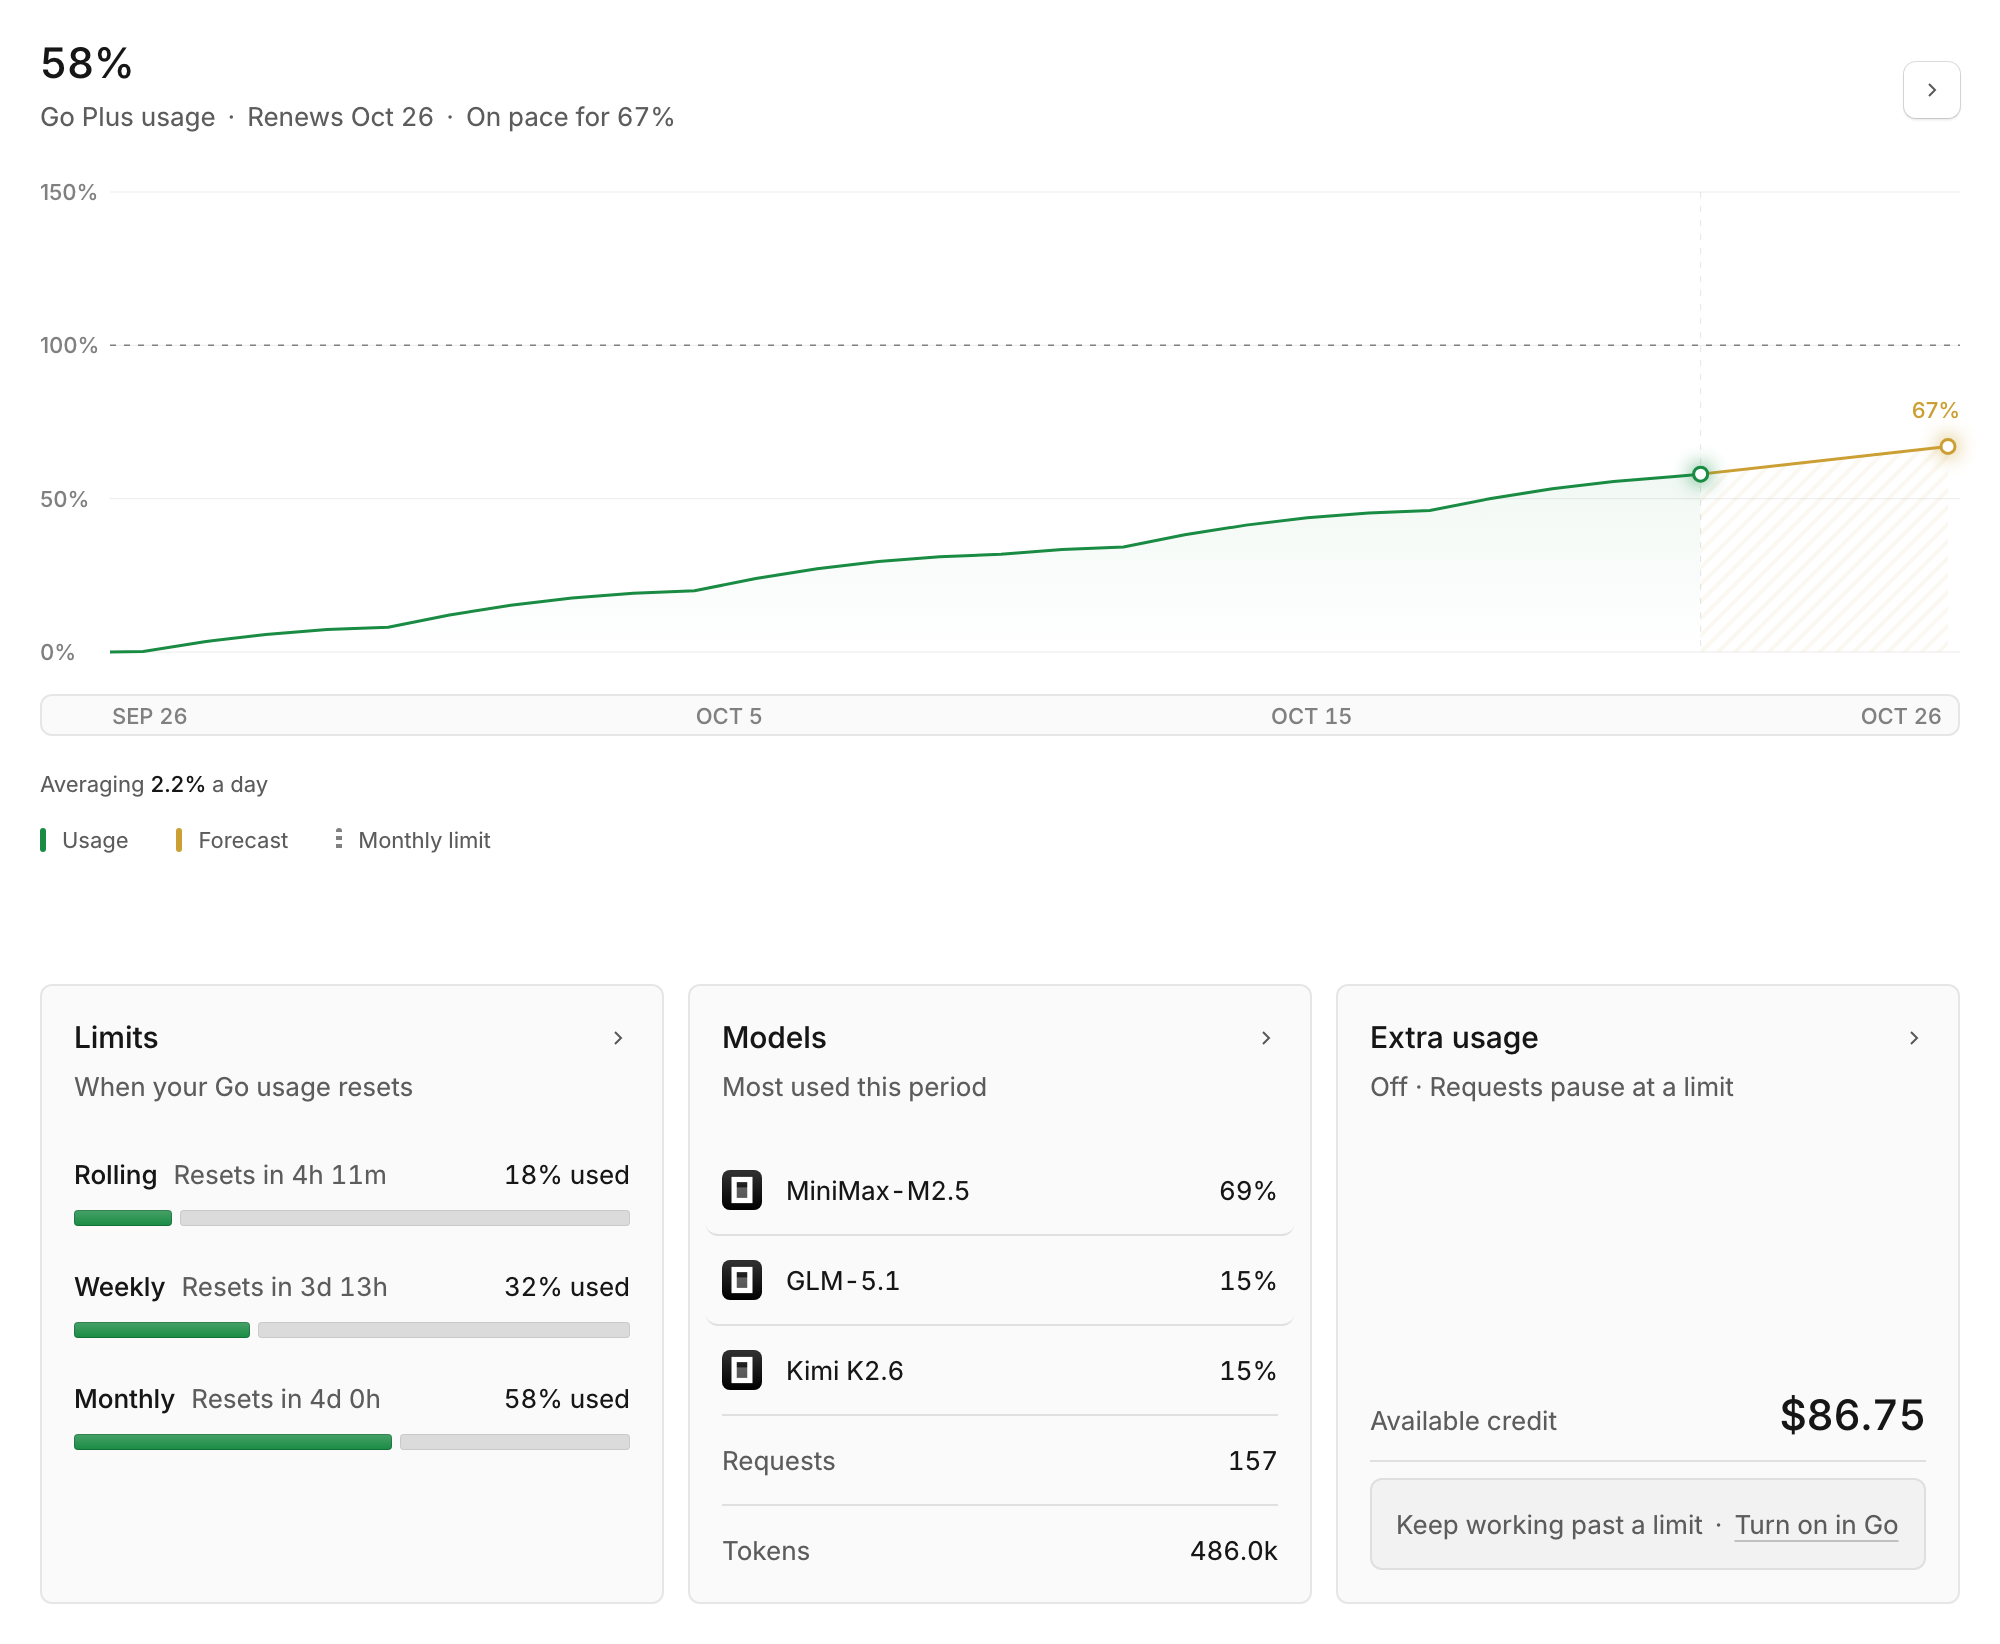
In a workspace with an OpenCode Go subscription, owners and admins see Go usage instead: how much of this period's allowance is used and where it's headed before renewal, when each limit resets, the most-used models, and whether extra usage is on.